
Photo credit: Michelle Lambert
Renovation or New Building?: A Carbon Analysis of the Springfield Hall of Justice
Project Team: Lambert Sustainability and Sustainable Performance Institute
The MA Division of Capital Asset Management and Maintenance (DCAMM) commissioned an embodied carbon analysis of the Hampden County Hall of Justice (HOJ) in Springfield, MA in order to compare scenarios for renovating the existing building or demolishing it and building a new courthouse. The HOJ is in need of a major renovation or a full facility replacement and DCAMM is considering three alternatives under separate studies and assessments
A comprehensive renovation of the entire existing building,
Full demolition and construction of a new building on the same site, or
Construction of a new building elsewhere in Springfield and disposing of the property.
Working with DCAMM and the renovation project design team, our team assessed the carbon impacts of the three alternative scenarios to help inform a final decision that considers embodied carbon along with other important factors.
Section 1 – Existing Building
The existing Hampden County Hall of Justice Building, also referred to as the Roderick L. Ireland Courthouse, is located at 50 State Street in Springfield, Massachusetts. It is a four-story Brutalist style concrete and glass building designed by Argentine architect Eduardo Catalano and constructed from 1973-76.
The building program includes the Superior Court (SC), District Court (DC) and Probate and Family Court (PFC). It is one of the state’s highest volume court facilities.

Photo credit: Michelle Lambert
The building consists of 270,325 total square feet which includes the below grade parking garage and basement, four floors of courthouse spaces and the rooftop penthouse. For the embodied carbon analysis, 229,000 square feet was used as the study area, which includes floors 1-4 above grade, the basement mechanical and utility spaces and the penthouse, but not the parking garage. The parking garage is located under the building and the adjacent outdoor plaza, and contains 80 parking spaces. For the analysis, it is assumed the garage will remain and get re-striped in the renovation scenario.

Photo credit: Michelle Lambert
Existing Building Operational Energy Use
The original courthouse building HVAC system was fully electric resistance heat, but this was converted to natural gas in the 1990’s. In 2004 there was an electrical systems upgrade, but this did not include the HVAC systems. The HOJ building currently shares a gas-fired central plant with the Juvenile Court (JC) and Housing Court (HC) building located across the plaza. The central plant is located in the basement of the adjacent building and is connected through the parking garage. The Juvenile Court and Housing Court building is approximately 48,900 sf and was not included in the analysis for either the renovation or new building scenarios.
Because of the shared plant, the gas utility bills for the two buildings are combined. Using the actual utility bills for the buildings, including the combined gas bill and the separate electric bills, IMEG Corp. was able to calculate an Energy Use Intensity (EUI) of 94.9 kBtu/ft2-yr. for the two buildings combined. IMEG then did an analysis separating out the gas usage by square footage and excluding the electric use of the garage, and estimated an EUI of 86.2 kBtu/ft2-yr. for just the HOJ building.
Because the utility bill information was not complete and the estimate for the HOJ building alone was based on an extrapolation, the team decided to run the carbon analysis using the Default EUI for a Courthouse use from the CARE Tool database which is 90.6 kBtu/ft2-yr. This falls between the two approximate EUI’s calculated above and is therefore a reasonable baseline to assume. We also assumed that the garage would not be included in the building square footage or in the EUI calculation, so therefore the analysis is for just the building program.
The window-to-wall ratio (WWR) varies on each building façade and the calculated average for all four facades is 30.2%. This is slightly lower than the CARE Tool’s default WWR of 35% so the actual WWR percentage was used for the analysis.
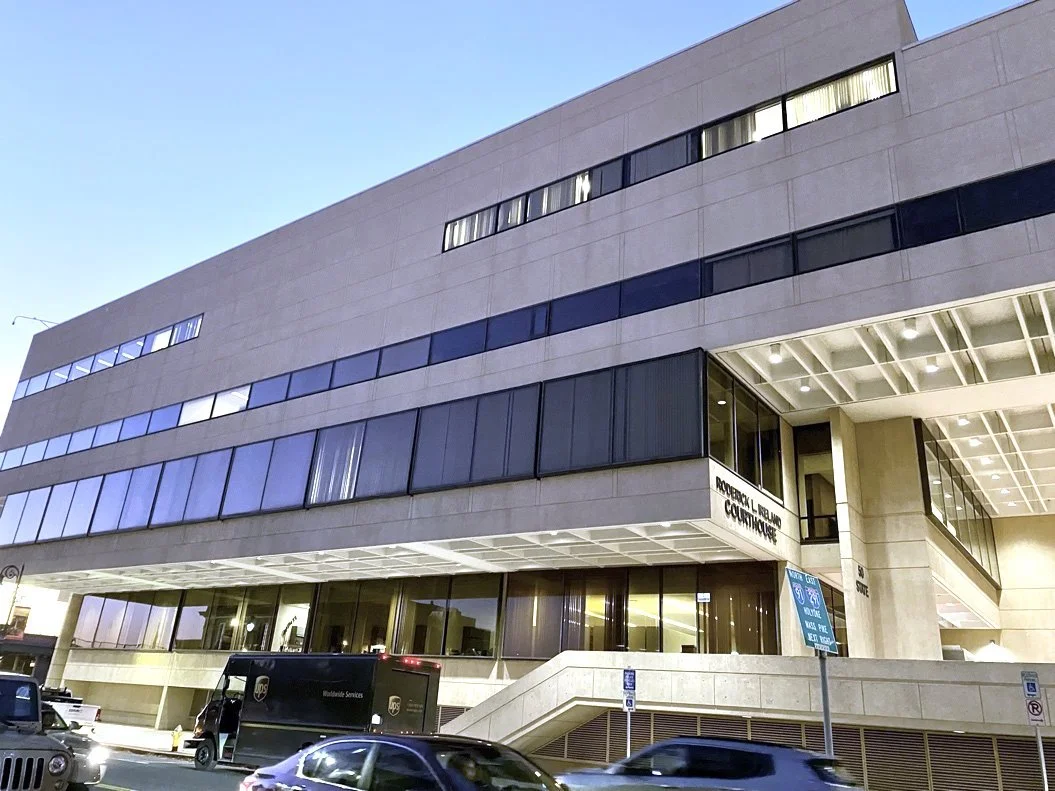
Photo credit: Michelle Lambert
Section 2 – Building Renovation Scenario
The building renovation scenario design team includes Habeeb and Associates Architects and IMEG Corp. Engineers. If the scenario to reuse the HOJ building is pursued, extensive renovation work has been proposed with the following assumptions:
Replacement of most of the exterior wall assembly with a new rainscreen system and new insulation,
Addition of insulation to the soffits to reduce thermal bridging at the cantilevers,
Replacement of the windows with new double-paned units,
Full replacement of the roofing, insulation and skylights,
Complete replacement of the mechanical, electrical and plumbing systems,
Replacement of approximately 90% of the interior finishes. The terrazzo flooring in circulation areas would remain.
New central elevator core (to improve detainee circulation),
The structural systems will remain in place and do not require any significant repair or replacement.
The only addition to the existing building in this scenario would be for a small lobby space of approximately 4,000 sf.
Renovation Operational Energy Use
IMEG created an energy model for the renovated building scenario using an all-electric chilled beam HVAC system with direct outside air (DOAS), perimeter baseboard heating, and the new U-values of the replaced wall assembly and roof systems. The energy model produced an estimated Energy Use Intensity (EUI) of 32.4 kBtu/ft2-yr., which was used as the input for the CARE Tool carbon analysis assumption for the renovation. For comparison, the new Lowell Justice Center, built by DCAMM in 2020, which is a LEED Platinum Certified building, has an EUI of 35 /ft2-yr.
The renovated building is proposed to add a 520-kW ballasted rooftop solar photovoltaic system on the roughly 50,000 square foot roof. This will generate 53 kBtu/sf/yr of electricity or approximately 8% of the building’s total electricity use.
Section 3 – New Building Scenario
In order to create an apples-to-apples comparison, the hypothetical new building scenario we used for the analysis would be to construct a building that only includes the program from the HOJ Courts and does not combine with the Juvenile Court (JC) and Housing Court (HC) currently located in the adjacent building across the plaza. The new building would not include a parking garage, but would instead provide parking in a surface lot. The renovation square footage and EUI do not include the existing parking garage so the two scenarios are comparable in that sense.
The new building program is based on the proposed assumption of 300,000 sf in order to address some space inadequacies in the existing building. This is an increase over the total building renovation scenario program, but conveys the realistic options being studied by DCAMM. The new building is assumed to be constructed of a typical steel and concrete structure.
New Building Operational Energy Use
The new building scenario is assumed to have the same all-electric chilled beam and DOAS HVAC system as the renovation scenario, and therefore has the same EUI modeled assumption of 32.4 kBtu/ft2-yr.
The percentage of renewable energy contribution of the rooftop PV system is assumed to be the same as the renovation scenario for simplicity and comparability of analysis.
Section 4 – Embodied Carbon Analysis
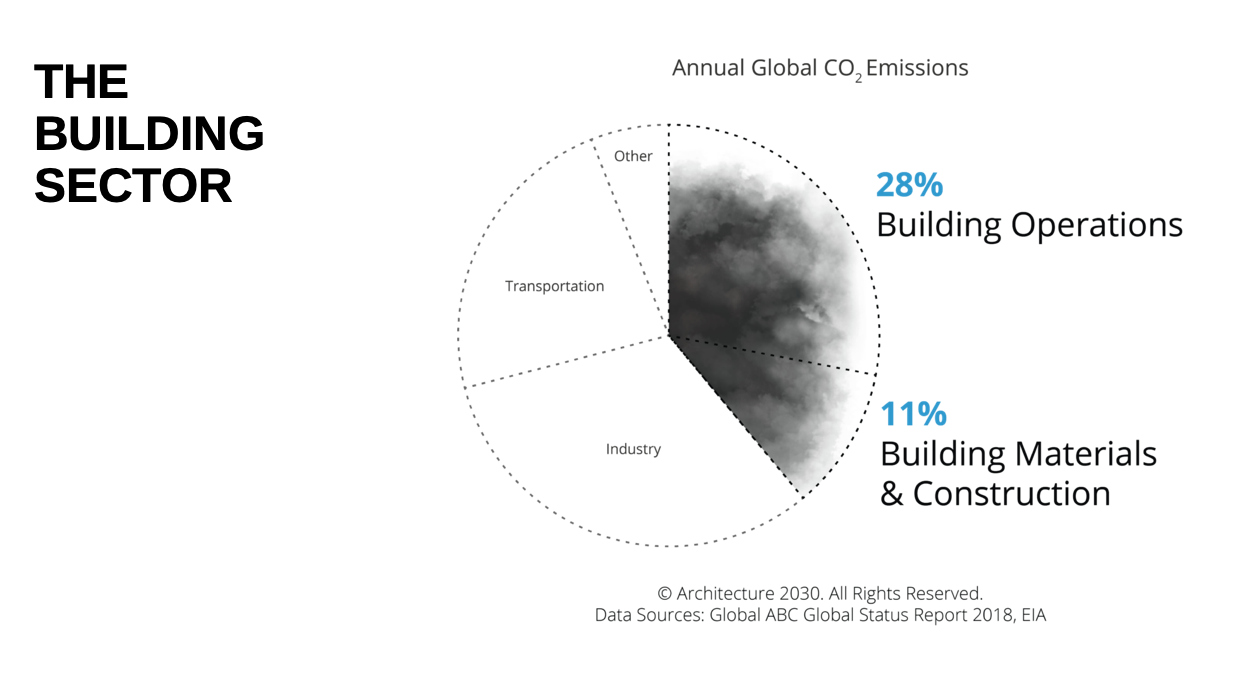
Each year, the built environment contributes almost 40% of CO2 emissions worldwide. Most of this, 28%, is due to the energy required to operate our buildings- the lighting, equipment, heating and cooling. That is the operating energy consumption which results in the operational carbon. But the embodied carbon of our building materials are responsible for an additional 11% of our global CO2 emissions.
The illustration below depicts the difference between embodied carbon and operational carbon.

Illustration credit: Stacy Smedley, climategifs.com
Operational carbon (on the right) – which we are more familiar with, is the carbon emissions associated with the energy production used to heat, cool and electrify our buildings after they are built. That carbon starts being generated on day one of occupancy. Embodied Carbon (on the left)- is the carbon emissions associated with the materials and construction processes throughout the whole life cycle of a building. It is the sum impact of all greenhouse gas emissions attributed to the building materials starting from the sourcing, mining, manufacturing process, transportation, installation and construction energy, the maintenance/replacement throughout the building’s life, and the end of life/disposal of the building.
Total carbon or whole life carbon of a building is the sum of both embodied and operational carbon. To reach net zero total carbon, which is a goal of the Commonwealth of MA, a building must minimize both the operational and embodied carbon over the building’s life cycle.
The CARE Tool (Carbon Avoided: Retrofit Estimator)
There are a number of tools now available to measure the embodied carbon in buildings. But there is only one to date that is specifically designed to measure the embodied carbon of an existing building and compare scenarios for renovating versus tearing down and building new, in order to look at the carbon impact of those decisions. The pilot was recently launched in November 2022 by Architecture 2030 and is called the CARE Tool- for Carbon Avoided: Retrofit Estimator. The tool is open access online and free to use at https://architecture2030.org/caretool/
“The CARE Tool is an online tool for calculating and comparing the embodied, operating and avoided carbon impacts and benefits of reusing and upgrading existing buildings or replacing them with new construction. Renovating an existing structure usually has a much lower carbon footprint than building new because renovations typically reuse most of the carbon intensive parts of the building — the foundation, structure and building envelope. Retrofitting an existing building can also dramatically reduce its operating emissions.” -Architecture 2030
We chose to use the CARE Tool for this analysis, and are one of the first pilot projects to use it.
Electricity Grid Emissions Assumptions-
The current version of the CARE Tool uses the National Renewable Energy Laboratory (NREL) Cambium grid projection scenarios which contain hourly emission, cost and operational data for modeled futures of the US electric sector with metrics designed to be useful for long-term decision-making. https://www.nrel.gov/analysis/cambium.html
The tool allows you to choose from several scenario options in order to make it as close to the projected electricity grid scenario by region of the U.S:
No Change (no new renewables will be added to the grid)
Midcase Renewables
High Renewables
Full Decarbonization
Per Massachusetts Senate Bill 9 – ‘An Act Creating a Next Generation Roadmap for Massachusetts Climate Policy,’ adopted in April 2021, and Bill H.5060- ‘An Act Driving Clean Energy and Offshore Wind,’ adopted in August 2022, Massachusetts has committed to net zero greenhouse gas emissions in all sectors by 2050. Based on this goal, we chose the ‘high renewables’ grid scenario for the analysis.
The CARE Tool contains a series of tabs to enter information about the project scenarios. The first tab requires information about the existing building, the second tab requires information about the planned renovation and any additions, and the third tab is where you input information pertaining to the new building scenario. The screenshots below include all of the data inputs and assumptions that were used in this analysis for the HOJ, with details noted in red.
CARE Tool Inputs


Section 5 – Carbon Analysis Results
The first set of carbon analysis results compares the different building scenarios over an 8-year period, out to the year 2030, which is a milestone often used for climate goals and emissions reductions targets. In the bar chart below, on the left is the scenario of “do nothing” which reflects the existing building as it stands and operates today. The orange indicates the operational energy emissions generated. The building today, if left as is, would generate just over 15,000 metric tons of CO2 equivalent over the next 8 years.
Note: Carbon dioxide equivalent abbreviated as CO2-eq is a metric measure used to compare the emissions from various greenhouse gases on the basis of their global-warming potential (GWP), by converting amounts of other gases to the equivalent amount of carbon dioxide with the same global warming potential.

In the center is the building reuse and renovation scenario with a small lobby addition. The replacement of the mechanical systems, along with the new enclosure including replaced insulation and windows, reduces the operational energy and emissions significantly, by about 2/3. The blue bar represents the embodied emissions from the new replacement materials added to the building, which is approximately 2,800 metric tons of CO2e.
On the right is the scenario in which the existing building is demolished and replaced with a new courthouse building. The operational emissions are a little higher because the replacement building would be designed to be slightly larger than the existing building to account for some current space constraints. The blue bar represents the embodied emissions of all the new building materials, which is about 4.5 times the amount of embodied carbon generated by the reuse scenario.

This second results output from the tool shows the total CO2 emissions as it tracks over time. On this line graph you can see the embodied carbon generated in year zero, when the building renovation or replacement is completed and ready for occupancy. The yellow line is the new building scenario, which starts with the highest embodied carbon, and the blue line representing the reuse scenario, adds some but much less. The lines add the operational energy or emissions generated in each year out to the year 2030. And on the far right you can see the total carbon from each scenario after 8 years.
Because of the large embodied carbon input at the start, over 8 years the new building scenario actually ends up being worse from a total carbon perspective than the ‘do nothing’ scenario, in red.
The team also did a run of the CARE Tool to the year 2050, below, to see the total carbon impacts at that milestone year, when Massachusetts has committed to achieve net zero greenhouse gas emissions.

The embodied carbon stays the same as the previous since the analysis doesn’t include the nuance of the periodic maintenance or replacement of materials. But the operational emissions over the additional years adds up.

Over the next 28 years to 2050, the ‘do nothing’ scenario in red by far has the highest total carbon (nearly 46,000 metric tons), the new building in yellow would use about 30% less carbon (32,000 metric tons), and the reuse scenario in blue is almost half of the new building over this time period (17,800 metric tons).
To help visualize what those metric tons of CO2 equivalent really mean, the below graphics were created based on the EPA carbon equivalency calculator. The renovation scenario saves 10,014 metric tons of CO2e compared to the new building scenario, just in the first year. That embodied carbon avoided is the equivalent to the greenhouse gas emissions from 2,158 gas powered vehicles driven for one year.

Looking at it a different way, the 10,014 metric tons of CO2e avoided is also the equivalent to the carbon sequestered by 11,851 acres of US forests in one year. The area of the City of Springfield is just over 21,000 acres so that theoretical forest would cover about half the city and grow for one year to sequester that same amount of carbon saved by saving and reusing the existing building.

This carbon analysis using the innovative CARE Tool allowed the team to compare scenarios being considered by DCAMM to address the needs of the current HOJ building and its occupants, and to quantify the actual embodied carbon avoided by renovating the existing building compared to building new. The quantified and visualized carbon impact can now be included in the decision-making process for this project and its impact on the state’s path to meeting its climate goals.